Selecting the right features in your data can mean the difference between mediocre performance with long training times and great performance with short training times.
The caret R package provides tools to automatically report on the relevance and importance of attributes in your data and even select the most important features for you.
In this post you will discover the feature selection tools in the Caret R package with standalone recipes in R.
After reading this post you will know:
- How to remove redundant features from your dataset.
- How to rank features in your dataset by their importance.
- How to select features from your dataset using the Recursive Feature Elimination method.
Kick-start your project with my new book Machine Learning Mastery With R, including step-by-step tutorials and the R source code files for all examples.
Let’s get started.

Confidence Intervals for Machine Learning
Photo by Paul Balfe, some rights reserved.
Need more Help with R for Machine Learning?
Take my free 14-day email course and discover how to use R on your project (with sample code).
Click to sign-up and also get a free PDF Ebook version of the course.
Remove Redundant Features
Data can contain attributes that are highly correlated with each other. Many methods perform better if highly correlated attributes are removed.
The Caret R package provides the findCorrelation which will analyze a correlation matrix of your data’s attributes report on attributes that can be removed.
The following example loads the Pima Indians Diabetes dataset that contains a number of biological attributes from medical reports. A correlation matrix is created from these attributes and highly correlated attributes are identified, in this case the age attribute is removed as it correlates highly with the pregnant attribute.
Generally, you want to remove attributes with an absolute correlation of 0.75 or higher.
Rank Features By Importance
The importance of features can be estimated from data by building a model. Some methods like decision trees have a built in mechanism to report on variable importance. For other algorithms, the importance can be estimated using a ROC curve analysis conducted for each attribute.
The example below loads the Pima Indians Diabetes dataset and constructs an Learning Vector Quantization (LVQ) model. The varImp is then used to estimate the variable importance, which is printed and plotted. It shows that the glucose, mass and age attributes are the top 3 most important attributes in the dataset and the insulin attribute is the least important.
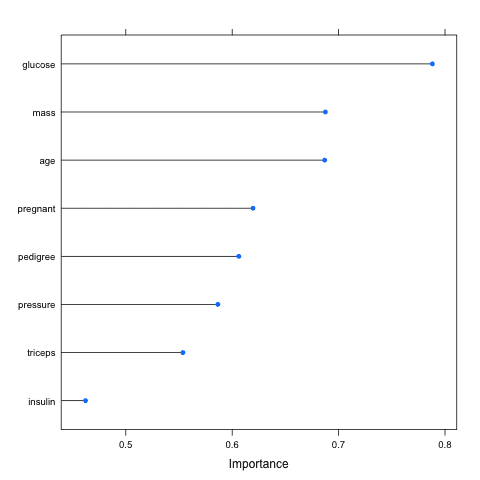
Rank of Features by Importance using Caret R Package
Feature Selection
Automatic feature selection methods can be used to build many models with different subsets of a dataset and identify those attributes that are and are not required to build an accurate model.
A popular automatic method for feature selection provided by the caret R package is called Recursive Feature Elimination or RFE.
The example below provides an example of the RFE method on the Pima Indians Diabetes dataset. A Random Forest algorithm is used on each iteration to evaluate the model. The algorithm is configured to explore all possible subsets of the attributes. All 8 attributes are selected in this example, although in the plot showing the accuracy of the different attribute subset sizes, we can see that just 4 attributes gives almost comparable results.

Feature Selection Using the Caret R Package
Summary
In this post you discovered 3 feature selection methods provided by the caret R package. Specifically, searching for and removing redundant features, ranking features by importance and automatically selecting a subset of the most predictive features.
Three standalone recipes in R were provided that you can copy-and-paste into your own project and adapt for your specific problems.






No comments:
Post a Comment