Product

Showing posts with label Dat Science. Show all posts

Tuesday, 30 June 2026

When AI Costs More than the Engineer


Anthropic spends 2.3x its payroll on compute.1 With ~5,000 employees & roughly $10b in inference & training spend in 2026, that works out to about $2m of compute per employee per year against a likely all-in comp of $500k+.2

The rest of the software market trails. The top 1% of companies spend $89k per engineer per year on AI, 40% of a fully-loaded $224k senior engineer salary3.4 The median spends $137. That is the gap : 2.3x at the frontier, 0.4x at the top of the market, near zero at the median.

How close does the rest of the market get? Three scenarios bracket the answer.

Article content

Bear (token deflation wins), Base (top-1% trajectory tapers), Bull (rest of market reaches Anthropic’s ratio by 2029). Each scenario maps to an annual AI bill per engineer.5

Article content


In the Bull case, the AI bill alone per engineer matches an entire median-SaaS employee’s revenue contribution.6 Anthropic & OpenAI already generate $14m & $6.5m in revenue per employee, the highest in the Forbes Global 2000.7

The cost structure follows the revenue structure.

Bull drivers : frontier model prices hold as training costs plateau & demand outruns supply. Agentic workflows consume tokens at orders-of-magnitude higher rates than chat, with Goldman Sachs projecting a 24-fold rise in token consumption by 2030.8 If a rival ships features faster, the AI bill stops being optional.

Bear counterweights : token prices have fallen 10x per year for three years.9 Open-weight models close the quality gap at a fraction of the cost.10 Companies that ration usage by role or workload bend the curve.

Article content

One of these scenarios will land closer to truth in 2029. Which one are you modeling for 2027?


  1. Goldman Sachs, The AI Economy in 2026. At AI-native firms like Anthropic, compute spend runs ~2.3x staff costs, indicating a structural cost base where infrastructure dominates payroll. See also industry coverage : valueaddvc.com/ai-spending. ↩︎
  2. Anthropic headcount ~5,000 per SaaStr (June 2026). Inference & training spend ~$10b in 2026 against ~$5b revenue, via Fortune AI capex coverage. $10b / 5,000 = $2m compute per employee. All-in comp at top AI labs runs $500k+ per Levels.fyi Anthropic data. ↩︎
  3. Senior software engineer fully-loaded comp anchor at $224k/yr blends Levels.fyi Q1 2026 base salary data with the U.S. Bureau of Labor Statistics Employer Costs for Employee Compensation 2026 benefits loading. Top-tier firms ride higher. ↩︎
  4. Ramp AI Index, June 2026. ramp.com/data/ai-index-june-2026. Top-1% firms spend $7,449/employee/month ($89k/yr) on AI, growing 14.1% month-over-month; median firm spends $11.38/month ($137/yr); 680x spending gap between leaders & the median. ↩︎
  5. Methodology. Senior engineer fully-loaded comp anchors at $224k/yr today & grows ~5%/yr (BLS wage trend). Each scenario’s % of salary path drives annual AI spend per engineer. Bear path (% of salary by year) : 40, 45, 48, 41. Base path : 40, 70, 105, 140. Bull path : 40, 110, 180, 230. Bear dollars rise through 2028 then dip in 2029 as the ratio falls faster than salary inflation. ↩︎
  6. Public SaaS revenue-per-employee benchmarks from KeyBanc Capital Markets SaaS Survey & OPEXEngine 2025-26 cohorts. Median ~$250k; top-quartile $400k-600k depending on company stage & vertical. ↩︎
  7. Epoch AI, Revenue Per Employee at AI Companies, 2026. epoch.ai/data-insights/revenue-per-employee-ai-companies. Anthropic ~$14m, OpenAI ~$6.5m per employee, the highest in the Forbes Global 2000. ↩︎
  8. Goldman Sachs Research forecasts agentic AI workloads driving a 24x increase in token consumption by 2030 vs current chat-dominated usage patterns. ↩︎
  9. OpenAI’s GPT-4 class input pricing fell from $30 per million tokens at launch (March 2023) to under $3 by 2026, roughly a 10x per year deflation rate on equivalent capability. Similar declines visible across Anthropic Claude & Google Gemini SKUs. ↩︎
  10. DeepSeek-V3 & subsequent open-weight releases delivered frontier-comparable benchmarks at 1/10th to 1/30th the API cost of leading proprietary models, per Ramp’s June 2026 observation that top firms are “mixing frontier models with cheap open-source” to control costs.

Saturday, 21 March 2026

5 Lesser-Known Visualization Libraries for Impactful Machine Learning Storytelling


5 Lesser-Known Visualization Libraries for Impactful Machine Learning Storytelling

5 Lesser-Known Visualization Libraries for Impactful Machine Learning Storytelling
Image by Editor | ChatGPT

Introduction

Data storytelling often extends into machine learning, where we need engaging visuals that support a clear narrative. While popular Python libraries like Matplotlib and its higher-level API, Seaborn, are common choices among developers, data scientists, and storytellers alike, there are other libraries worth exploring. They offer distinctive features — such as less common plot types and rich interactivity — that can strengthen a story.

This article briefly presents five lesser-known libraries for data visualization that can provide added value in machine learning storytelling, along with short demonstration examples.

1. Plotly

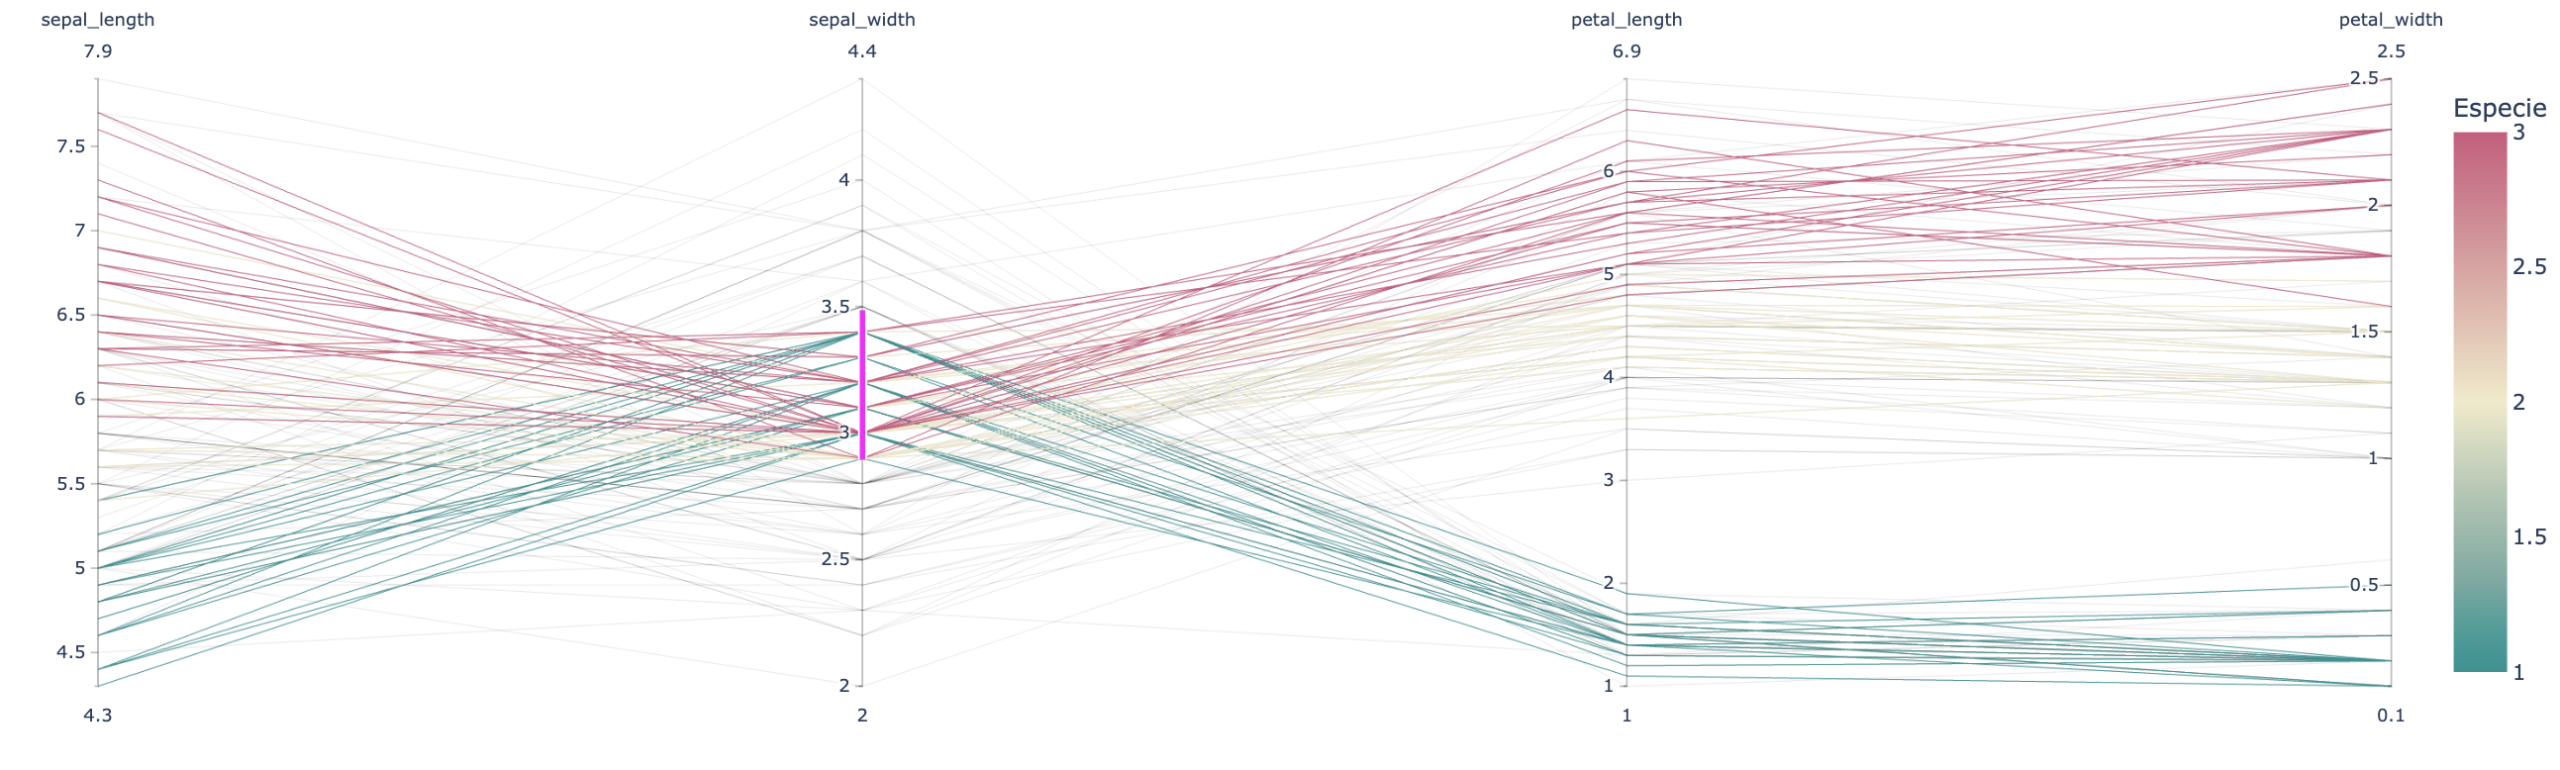
Perhaps the most familiar among the “lesser-known” options here, Plotly has gained traction for its straightforward approach to building interactive 2D and 3D visualizations that work in both web and notebook environments. It supports a wide variety of plot types—including some that are unique to Plotly — and can be an excellent choice for showing model results, comparing metrics across models, and visualizing predictions. Performance can be slower with very large datasets, so profiling is recommended.

Example: The parallel coordinates plot represents each feature as a parallel vertical axis and shows how individual instances move across features; it can also reveal relationships with a target label.

Plotly example

Plotly example

2. HyperNetX

HyperNetX specializes in visualizing hypergraphs — structures that capture relationships among multiple entities (multi-node relationships). Its niche is narrower than that of general-purpose plotting libraries, but it can be a compelling option for certain contexts, particularly when explaining complex relationships in graphs or in unstructured data such as text.

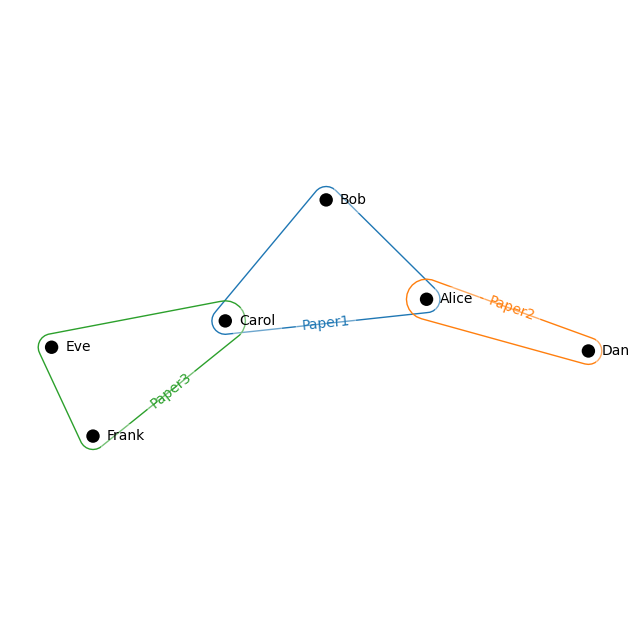
Example: A simple hypergraph with multi-node relationships indicating co-authorship of papers (each cyclic edge is a paper) might look like:

HyperNetX example

HyperNetX example

3. HoloViews

HoloViews works with backends such as Bokeh and Plotly to make declarative, interactive visualizations concise and composable. It’s well-suited for rapid exploration with minimal code and can be useful in machine learning storytelling for showing temporal dynamics, distributional changes, and model behavior.

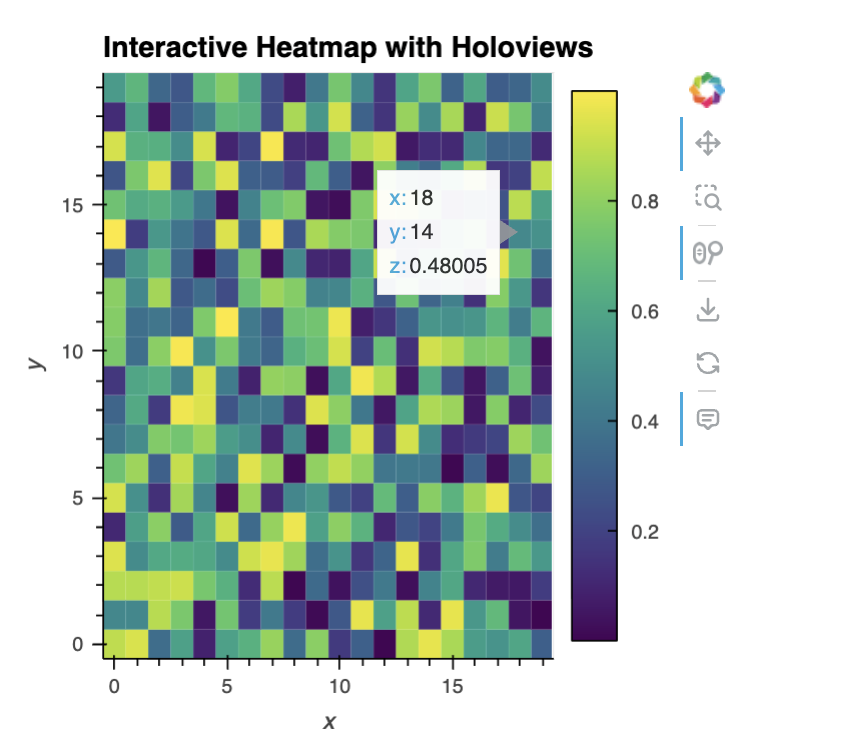
Example: The following snippet displays an interactive heatmap with hover readouts over a 20×20 array of random values, akin to a low-resolution image.

Holoviews example

HoloViews example

4. Altair

Similar to Plotly, Altair offers clean, interactive 2D plots with an elegant syntax and first-class export to semi-structured formats (JSON and Vega) for reuse and downstream formatting. Its 3D support is limited and large datasets may require downsampling, but it’s a great option for exploratory storytelling and sharing artifacts in reusable formats.

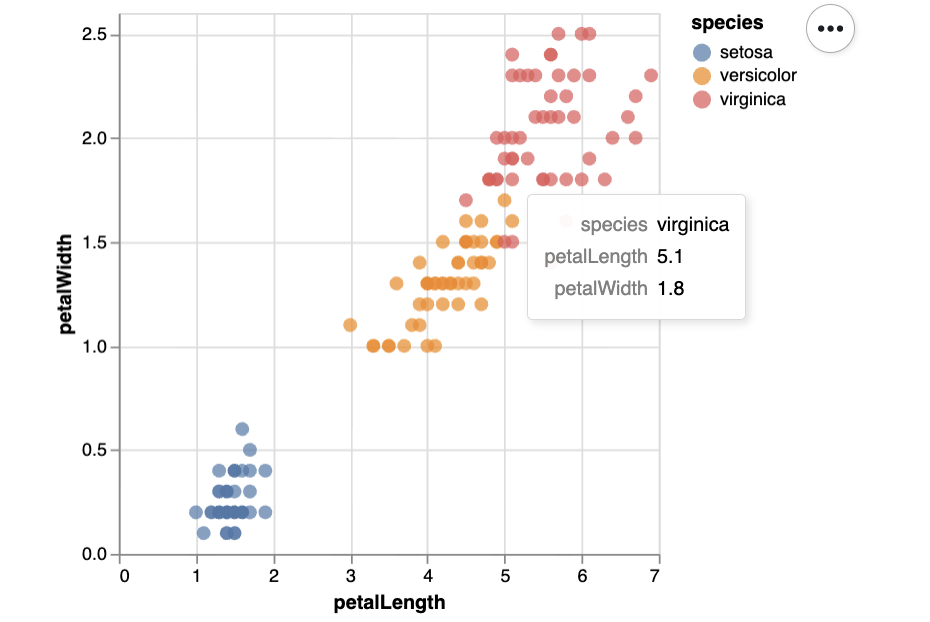
Example: A 2D interactive scatter plot for the Iris dataset using Altair.

Altair example

Altair example

5. PyDeck

pydeck excels at immersive, interactive 3D visualizations — especially maps and geospatial data at scale. It’s well suited to storytelling scenarios such as plotting ground-truth house prices or model predictions across regions (a not-so-subtle nod to a classic public dataset). It’s not intended for simple statistical charts, but plenty of other libraries cover those needs.

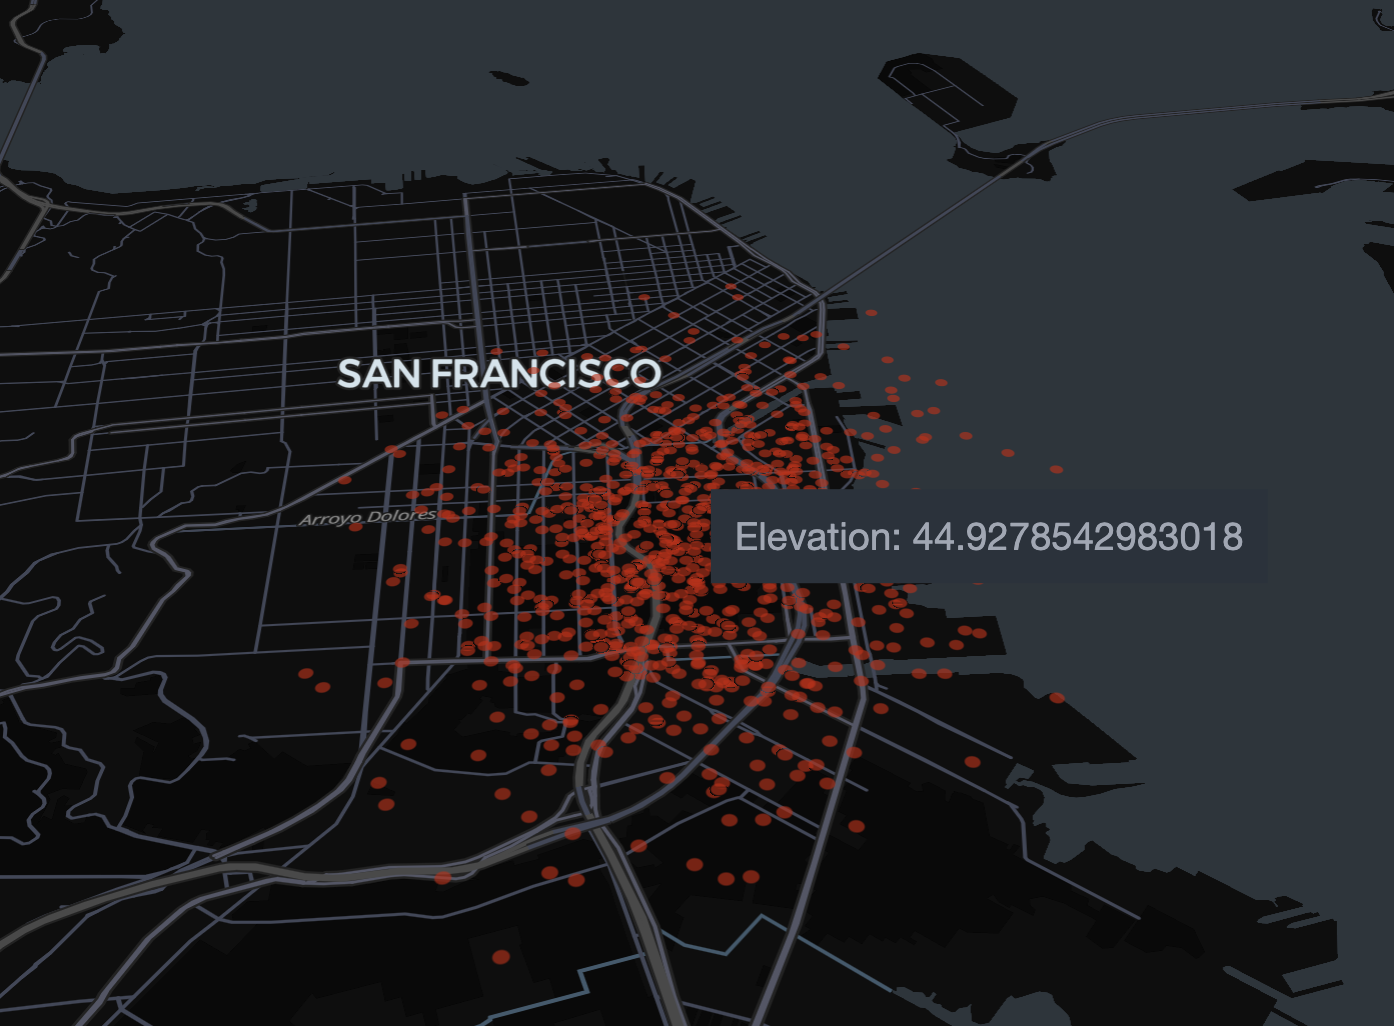
Example: This code builds an aerial, interactive 3D view of the San Francisco area with randomly generated points rendered as extruded columns at varying elevations.

Pydeck example

PyDeck example

Wrapping Up

We explored five interesting, under-the-radar Python visualization libraries and highlighted how their features can enhance machine learning storytelling — from hypergraph structure and parallel coordinates to interactive heatmaps, reusable Vega specifications, and immersive 3D maps.

Connect broadband

Why do governments, corporations, and experts promote eggs, meat, and other animal foods?

  Your question combines nutrition, public policy, ethics, religion, psychology, and AI. It's useful to separate evidence-based facts ...