The Caret R package allows you to easily construct many different model types and tune their parameters.
After creating and tuning many model types, you may want know and select the best model so that you can use it to make predictions, perhaps in an operational environment.
In this post you discover how to compare the results of multiple models using the caret R package.Let’s get started.
Compare Machine Learning Models
While working on a problem, you will settle on one or a handful of well-performing models. After tuning the parameters of each, you will want to compare the models and discover which are the best and worst performing.
It is useful to get an idea of the spread of the models, perhaps one can be improved, or you can stop working on one that is clearly performing worse than the others.
In the example below we compare three sophisticated machine learning models in the Pima Indians diabetes dataset. This dataset is a summary from a collection of medical reports and indicate the onset of diabetes in the patient within five years.
You can learn more about the dataset here:
The three models constructed and tuned are Learning Vector Quantization (LVQ), Stochastic Gradient Boosting (also known as Gradient Boosted Machine or GBM), and Support Vector Machine (SVM). Each model is automatically tuned and is evaluated using 3 repeats of 10-fold cross validation.
The random number seed is set before each algorithm is trained to ensure that each algorithm gets the same data partitions and repeats. This allows us to compare apples to apples in the final results. Alternatively, we could ignore this concern and increase the number of repeats to 30 or 100, using randomness to control for variation in the data partitioning.
Need more Help with R for Machine Learning?
Take my free 14-day email course and discover how to use R on your project (with sample code).
Click to sign-up and also get a free PDF Ebook version of the course.
Once the models are trained and an optimal parameter configuration found for each, the accuracy results from each of the best models are collected. Each “winning” model has 30 results (3 repeats of 10-fold cross validation). The objective of comparing results is to compare the accuracy distributions (30 values) between the models.
This is done in three ways. The distributions are summarized in terms of the percentiles. The distributions are summarized as box plots and finally the distributions are summarized as dot plots.
Below is the table of results from summarizing the distributions for each model.
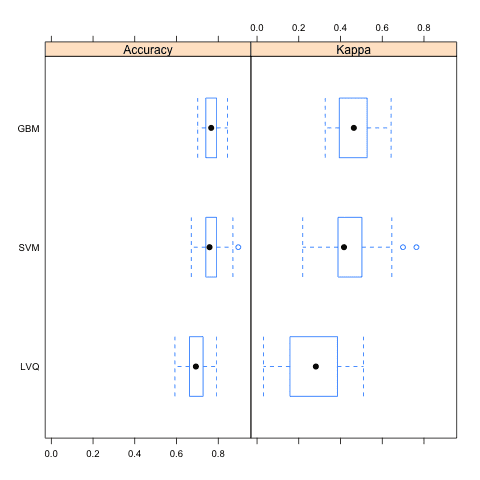
Box Plot Comparing Model Results using the Caret R Package
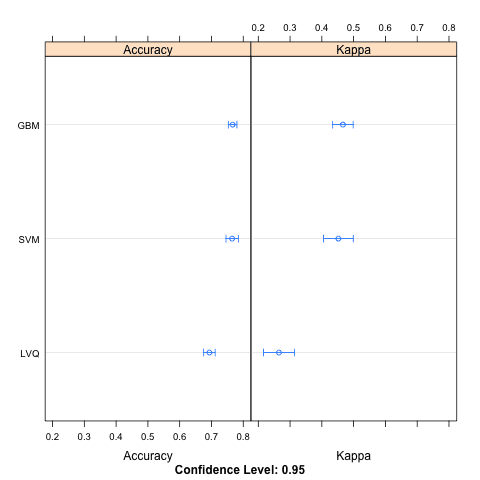
Dotplot Comparing Model Results using the Caret R Package
If you needed to make strong claims about which algorithm was better, you could also use statistical hypothesis tests to statistically show that the differences in the results were significant.
Something like a Student t-test if the results are normally distributed or a rank sum test if the distribution is unknown.
Summary
In this post you discovered how you can use the caret R package to compare the results from multiple different models, even after their parameters have been optimized. You saw three ways the results can be compared, in table, box plot and a dot plot.
The examples in this post are standalone and you can easily copy-and-paste them into your own project and adapt them for your problem.


No comments:
Post a Comment