The Keras library provides a way to calculate and report on a suite of standard metrics when training deep learning models.
In addition to offering standard metrics for classification and regression problems, Keras also allows you to define and report on your own custom metrics when training deep learning models. This is particularly useful if you want to keep track of a performance measure that better captures the skill of your model during training.
In this tutorial, you will discover how to use the built-in metrics and how to define and use your own metrics when training deep learning models in Keras.
After completing this tutorial, you will know:
- How Keras metrics work and how you can use them when training your models.
- How to use regression and classification metrics in Keras with worked examples.
- How to define and use your own custom metric in Keras with a worked example.
Tutorial Overview
This tutorial is divided into 4 parts; they are:
- Keras Metrics
- Keras Regression Metrics
- Keras Classification Metrics
- Custom Metrics in Keras
Keras Metrics
Keras allows you to list the metrics to monitor during the training of your model.
You can do this by specifying the “metrics” argument and providing a list of function names (or function name aliases) to the compile() function on your model.
For example:
The specific metrics that you list can be the names of Keras functions (like mean_squared_error) or string aliases for those functions (like ‘mse‘).
Metric values are recorded at the end of each epoch on the training dataset. If a validation dataset is also provided, then the metric recorded is also calculated for the validation dataset.
All metrics are reported in verbose output and in the history object returned from calling the fit() function. In both cases, the name of the metric function is used as the key for the metric values. In the case of metrics for the validation dataset, the “val_” prefix is added to the key.
Both loss functions and explicitly defined Keras metrics can be used as training metrics.
Keras Regression Metrics
Below is a list of the metrics that you can use in Keras on regression problems.
- Mean Squared Error: mean_squared_error, MSE or mse
- Mean Absolute Error: mean_absolute_error, MAE, mae
- Mean Absolute Percentage Error: mean_absolute_percentage_error, MAPE, mape
- Cosine Proximity: cosine_proximity, cosine
The example below demonstrates these 4 built-in regression metrics on a simple contrived regression problem.
Note: Your results may vary given the stochastic nature of the algorithm or evaluation procedure, or differences in numerical precision. Consider running the example a few times and compare the average outcome.
Running the example prints the metric values at the end of each epoch.
A line plot of the 4 metrics over the training epochs is then created.
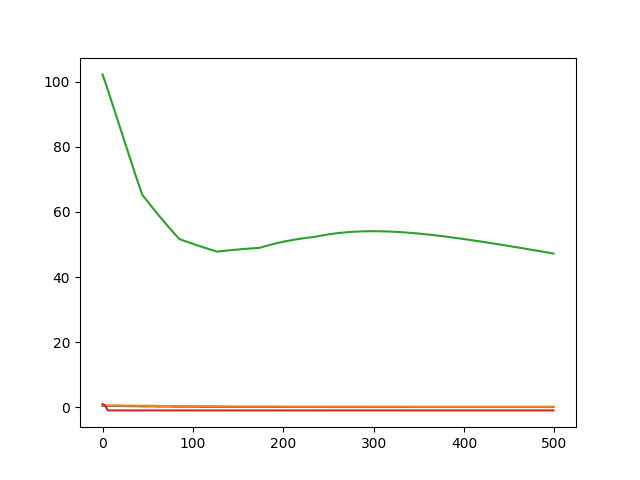
Line Plot of Built-in Keras Metrics for Regression
Note that the metrics were specified using string alias values [‘mse‘, ‘mae‘, ‘mape‘, ‘cosine‘] and were referenced as key values on the history object using their expanded function name.
We could also specify the metrics using their expanded name, as follows:
We can also specify the function names directly if they are imported into the script.
You can also use the loss functions as metrics.
For example, you could use the Mean squared Logarithmic Error (mean_squared_logarithmic_error, MSLE or msle) loss function as a metric as follows:
Keras Classification Metrics
Below is a list of the metrics that you can use in Keras on classification problems.
- Binary Accuracy: binary_accuracy, acc
- Categorical Accuracy: categorical_accuracy, acc
- Sparse Categorical Accuracy: sparse_categorical_accuracy
- Top k Categorical Accuracy: top_k_categorical_accuracy (requires you specify a k parameter)
- Sparse Top k Categorical Accuracy: sparse_top_k_categorical_accuracy (requires you specify a k parameter)
Accuracy is special.
Regardless of whether your problem is a binary or multi-class classification problem, you can specify the ‘accuracy‘ metric to report on accuracy.
Below is an example of a binary classification problem with the built-in accuracy metric demonstrated.
Note: Your results may vary given the stochastic nature of the algorithm or evaluation procedure, or differences in numerical precision. Consider running the example a few times and compare the average outcome.
Running the example reports the accuracy at the end of each training epoch.
A line plot of accuracy over epoch is created.
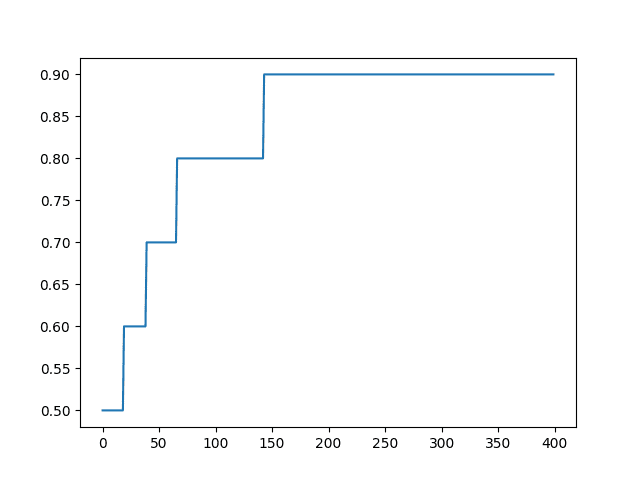
Line Plot of Built-in Keras Metrics for Classification
Custom Metrics in Keras
You can also define your own metrics and specify the function name in the list of functions for the “metrics” argument when calling the compile() function.
A metric I often like to keep track of is Root Mean Square Error, or RMSE.
You can get an idea of how to write a custom metric by examining the code for an existing metric.
For example, below is the code for the mean_squared_error loss function and metric in Keras.
K is the backend used by Keras.
From this example and other examples of loss functions and metrics, the approach is to use standard math functions on the backend to calculate the metric of interest.
For example, we can write a custom metric to calculate RMSE as follows:
You can see the function is the same code as MSE with the addition of the sqrt() wrapping the result.
We can test this in our regression example as follows. Note that we simply list the function name directly rather than providing it as a string or alias for Keras to resolve.
Note: Your results may vary given the stochastic nature of the algorithm or evaluation procedure, or differences in numerical precision. Consider running the example a few times and compare the average outcome.
Running the example reports the custom RMSE metric at the end of each training epoch.
At the end of the run, a line plot of the custom RMSE metric is created.
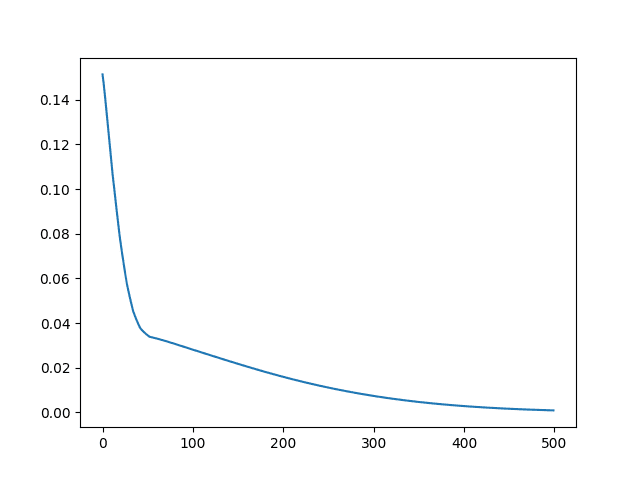
Line Plot of Custom RMSE Keras Metric for Regression
Your custom metric function must operate on Keras internal data structures that may be different depending on the backend used (e.g. tensorflow.python.framework.ops.Tensor when using tensorflow) rather than the raw yhat and y values directly.
For this reason, I would recommend using the backend math functions wherever possible for consistency and execution speed.
Further Reading
This section provides more resources on the topic if you are looking go deeper.
- Keras Metrics API documentation
- Keras Metrics Source Code
- Keras Loss API documentation
- Keras Loss Source Code
Summary
In this tutorial, you discovered how to use Keras metrics when training your deep learning models.
Specifically, you learned:
- How Keras metrics works and how you configure your models to report on metrics during training.
- How to use classification and regression metrics built into Keras.
- How to define and report on your own custom metrics efficiently while training your deep learning models.
Do you have any questions?
Ask your questions in the comments below and I will do my best to answer.


No comments:
Post a Comment